Material Characteristics
Noliac Technology
HysteresisAll piezoelectric materials exhibit a mechanical hysteresis as the strain does not follow the same track upon charging and discharging. The hysteresis is expressed as the maximum strain divided by the maximum difference between the two tracks. The mechanical hysteresis (in voltage) depends on the type of ceramics and can vary from 4% to 20%.
Please note: If it is important to know the exact displacement of the actuator at a given voltage, it is then recommended to use a sensor system, e.g. strain gauge mounted on the actuator (static applications) or an integrated piezo-sensor (dynamic applications) as a feedback system.Please note:If it is important to know the exact displacement of the actuator at a given voltage, it is then recommended to use a sensor system, e.g. strain gauge mounted on the actuator (static applications) or an integrated piezo-sensor (dynamic applications) as a feedback system. Another approach to strongly reduce the hysteresis effects consists of driving the piezoelectric actuator by controlling the transferred charge on the electrodes. [back to top] |
||||||||
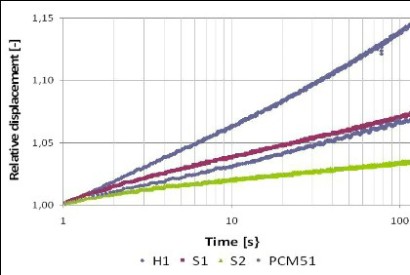
CreepPiezoelectric materials exhibit a creep effect i.e. the material continues to expand for some time upon charging. Correspondingly the material does not immediately return to the initial strain level upon discharging. The creep effect for different actuator materials is compared in the following figure, where the time for reaching 100% strain is shown. Creep always occurs in the same direction as the dimensional change produced by the voltage step. Typical values range from 1% to 20% with time constant between 10 and 100 seconds.
Creep for NCE51 (PCM51), NCE57(S1), NCE59(S2) and NCE46(H1) [back to top] |
||||||||
Extension under loadPiezoelectric actuators withstand very high axial pressure due to their solid-state nature. The properties of the actuator can vary to some extent depending on pre-stress or load conditions. This depends on the type of piezoelectric ceramic used. Some materials show stroke enhancement on mechanical loading, whereas other types are rather insensitive to load variations. Mechanical pre-stressing of stacked actuators is recommended for many applications and is usually applied in a kind of spring mechanism. Pre-stressing stacked actuators result in advantages such as:
|
||||||||
Power dissipationPiezoelectric elements are essentially capacitors. At temperatures well below the Curie temperature their internal resistance is in the order of 1010 Ohms. Consequently, under static operation virtually no current is drawn nor power consumed to maintain a state of activation. Power is only required to change the voltage on the PZT element. Whereas a perfect capacitor would dissipate no energy in charging and discharging, piezoelectric ceramics dissipate energy in the form of heat proportional to the dissipation factor (tan ?), the tangent of the loss angle for the material. The mechanism is similar to that by which any elastic material such as a rubber band becomes hot when stretched repeatedly. For comparison between the materials, the dissipation factor is usually specified for low electrical fields and at 1000Hz. Soft PZT materials have large dissipation factors in the order of 2% to 4% and hard PZT materials have dissipation factors in the order of 0.5%. The power dissipated by a piezoelectric element with a capacitance C, driven at a voltage V and frequency f can be calculated from the equation: P = 6,28 x f x C x tan(?) x V2 The resultant temperature rise will depend on factors such as the heat capacity of the device and what means exist for transferring that heat to the surroundings by convection, conduction and radiation. Parts with a large volume/surface ratio are more subject to self-heating in dynamic conditions than parts with a large surface/volume ratio. With soft PZT materials, the capacitance may increase rapidly with temperature due to increase in the dielectric constant approaching the Curie temperature. Consequently caution is necessary when running at high frequency to avoid thermal runaway by self-heating that might damage the actuator. [back to top] |
||||||||
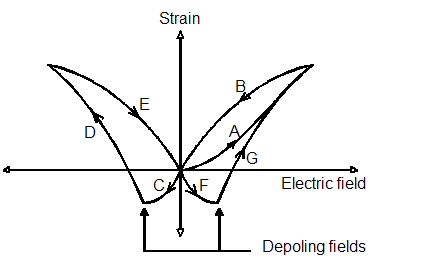
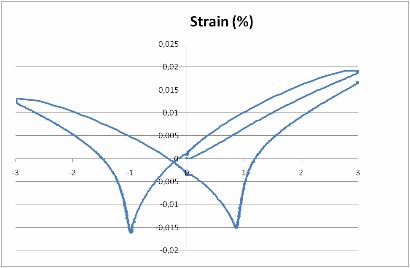
Operation under reverse biasIn addition to the normal hysteresis curve AB when the applied voltage is positive, the butterfly diagram CDEFG defines the behaviour of the material through a complete cycle of positive and negative operating electric fields. Negative electric fields produce negative strain along curve C until at the depoling field (coercive field) the extension suddently turns positive following the curve D. The process is repeated along curves EFG when the electric field is made positive again. The “butterfly” diagram provides a complete characterization of the depoling and repoling process.
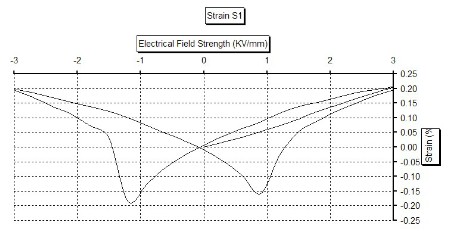
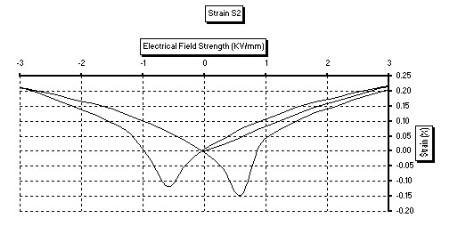
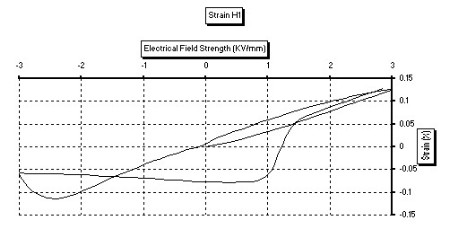
Most hard piezoelectric materials can only be poled or depoled at elevated temperatures so once poled, they can be used with either forward or reverse bias without difficulty. Soft piezoelectric materials are easily depoled when subjected to an electrical field opposite to the poling direction. The effect of cycling between positive and negative voltages for various piezoelectric materials is shown in the following figures: NCE57 (S1)
NCE59 (S2) and NCE46 (H1)
NCE51
Butterfly loop, NCE51 |
||||||||
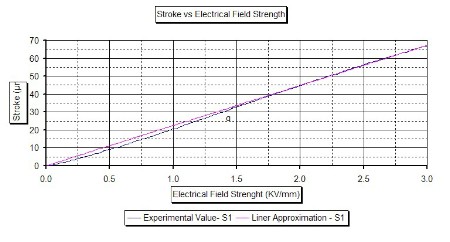
Linearity CMA/SCMA/CMBThe stroke versus applied voltage relationship for piezo electric actuators is not perfectly linear as predicted by the piezoelectric equations. Typical performances are shown in the following figures. As it can be seen, the extension vs voltage curve is actually slightly S-shaped. At low voltage, the curve for increasing voltage is concave upward and the shape is close to quadratic. At the high voltage end (>>3KV/mm) the electric field strength is approaching the limit where no further alignment of the electric dipoles inside the material can occur. NCE57 (S1)
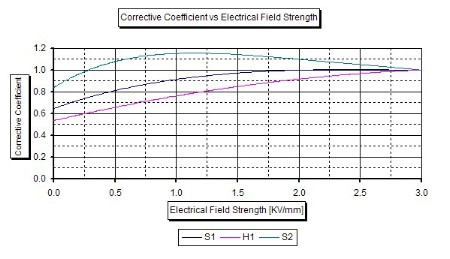
The “Corrective Coefficient vs Electrical Field Strength“ figure can be used to accurately estimate the free stroke for electrical field strength lower than 3KV/mm. This graph plots the ratio between the stroke obtained by a linear approximation to the experiment value for different materials and different electrical field strength.
NCE57 (S1), NCE46 (H1), and NCE59 (S2) The following example explains how to use the "corrective coefficient vs electrical field strength" curve: Example: Let's consider the following stack: Material: NCE46 Dimensions: 5 x 5 x 60 (mm) Active layers thickness: 67µm Max Operating Voltage: 200V Stroke @ 200V: 58µm What would the performances of this actuator be at 40V? Step 1: Calculate the operating electrical field. At 40V, the electrical field strength is 40V/66,7µm=0,6KV/mm. Step 2: Calculate stroke assuming performances are linear with the electrical field strength: Free stroke @ 40 V = Free stroke @ 200V x (40/200) = 58 x 40/200 = 11,6µm Step 3: On the graph, draw a vertical line starting from the calculated electrical field strength [0.6kV/mm]. From the intersection between this line and the H1 curve, draw a horizontal line. The intersection between this line and the Y-axis gives a value of ~ 0,7.This value is the corrective coefficient. Step 4: Multiply the free stroke and blocking force values obtained in step 2 by the corrective coefficient to get the estimated performances at 40V. Free stroke @ 40V: 11,6 x 0,7 = 8,12µm |
||||||||
Linearity CSAThe stroke versus applied voltage relationship for piezo electric actuators is not perfectly linear as predicted by the piezoelectric equations. Typical performances are shown in the following figures. As it can be seen, the extension vs voltage curve is actually slightly S-shaped. At low voltage, the curve for increasing voltage is concave upward and the shape is close to quadratic. At the high voltage end (>>3KV/mm) the electric field strength is approaching the limit where no further alignment of the electric dipoles inside the material can occur.
|
||||||||
Temperature dependence - NCE51
[back to top] |
||||||||
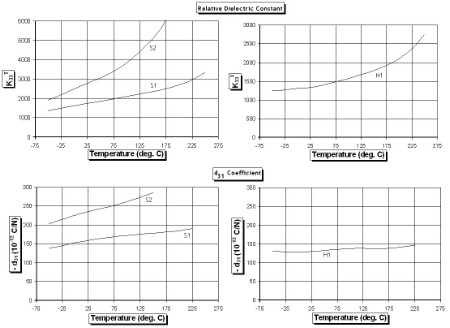
Thermal properties and temperature coeffecientsGeneralities The performance characteristics of the electric and piezoelectric properties are affected by temperature variations. Each piezoelectric material is affected differently by temperature changes, according to the method of manufacture and chemical composition of the material. Piezoelectric materials should be used well below their Curie temperature for the poling to be stable. Any conditions that raise the temperature close to the Curie temperature will cause the piezoelectric material to become partially or completely depolarised and severely degrade its piezoelectric properties. For applications that require operation at elevated temperature a material with a sufficiently high Curie temperature should be chosen. The mechanical and electrical properties of piezoelectric ceramic are greatly reduced at cryogenic temperatures. When piezoelectric actuators are cooled down to cryogenic temperatures, the piezoelectric ceramic behaves like a very hard piezoelectric material featuring:
The last point means, that at low temperatures a piezoelectric actuator becomes extremely stable against electrical depoling and other destabilizing effect. So a much wider bipolar operation compared to room temperature is possible now. Thereby, the loss in stroke for low temperature can be partially compensated for. A less known parameter is the thermal expansion coefficient for ceramics, important to consider when designing devices where piezoelectric actuators will be part of a composite structure and where the other elements of constructions are e.g metals. The thermal expansion coefficient for ceramics is similar to many ceramics and glasses and is typically in the range of 10-5 to 10-6/°C. A major difference with common materials is that the thermal expansion coefficient is anisotropic with respect to the poling direction. Temperature coefficients The changes in various material properties with temperature are shown in the following tables.
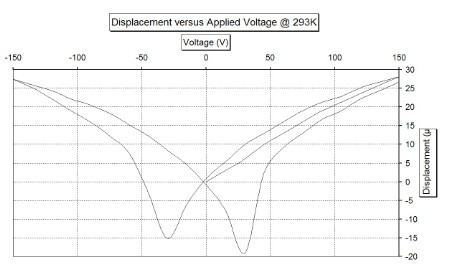
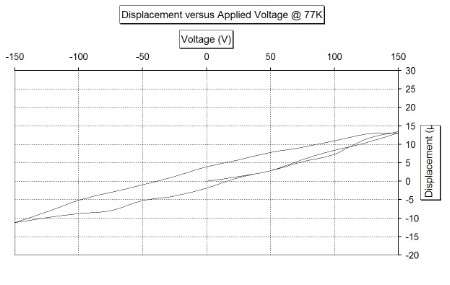
Stroke measurements at cryogenic temperatures with NCE59 Low voltage actuators Cryogenic measurements have been performed on a stack made of NCE59 material. The piezoelectric actuator, which dimensions is 5mm x 5mm x 20mm, was tested at room temperature and at liquid nitrogen temperature (77K). In both cases, the actuator was energized to 150 V (this corresponds to field strength of 3 kV/mm) and then looped between +150V and -150V. These data were used to produce the displacement vs. applied voltage curve at 77K and at room temperature as shown in the following figures.
As it can be seen the strain at 77 K is approximately reduced to half size at room temperature. Besides, a strong increase of the coercive field, it can also be observed that the actuator exhibits a fairly linear voltage-displacement characteristic at negative voltage. The piezoelectric actuator becomes extremely stable against electrical depoling and the loss in stroke at low temperature could be partially compensated by using a wide bipolar operation. |
||||||||
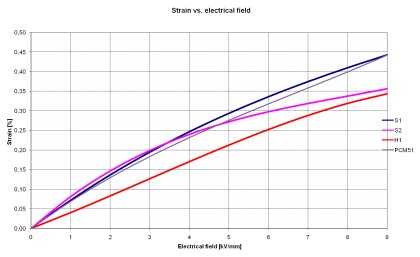
Very high electrical field dataIn some applications the customer wants to archive maximum strain from the piezo electric element only by applying a very high electrical field. In some cases the maximum recommended field strength of 3kV/mm may be exceeded e.g. for short-term use applications or static applications. Operating field of 4kV/mm is normally acceptable, however testing is recommended. In the figure below is shown how the strain evolves with electric field for our different materials up to a maximum electrical field strength of 9kV/mm. The fall back in applying a very high electric field is that the actuator lifetime is reduced drastically. The data in the figure are only of informative character and we recommend to contact our R&D before designing actuators based on very high electrical field.
NCE57 (S1), NCE59 (S2), NCE46 (H1), NCE5 (PCM51)
|
||||||||
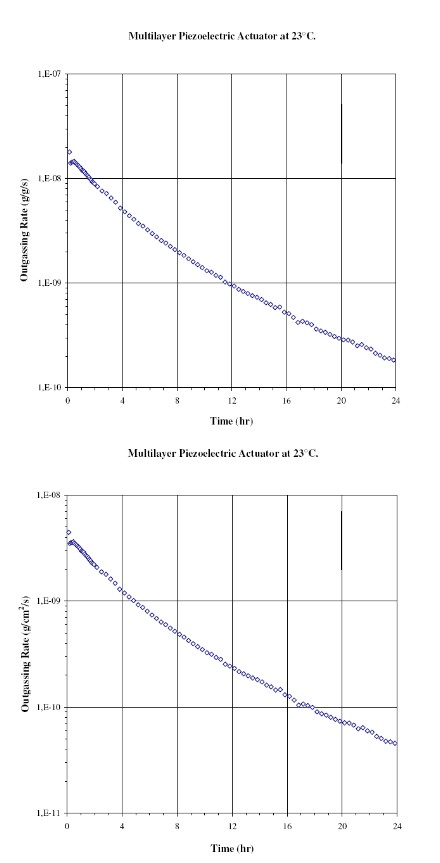
Ultra high vacuum compatibilityIt is widely acknowledged that PZT materials are UHV compatible. When stacking such PZT elements the use of glue, solder, flux and wires could compromise the otherwise inherent compatibility for device level products. It is the purpose of this paper to give an estimate on outgassed species and rate from a Noliac Stacked Ceramic Multilayer Actuator (SCMA). For this purpose a SCMA consisting of 4 CMA’s and 2 endplates has been prepared. The overall dimensions of the SCMA are 5mm x 5mm x 10mm, having 5 glue joints each of 20mm length. The SCMA was equipped with standard buswire and 2 Kapton coated multi-core wires of 200mm length each. Cleaning: The excess glue is mechanically removed during the stacking process and during the curing. After curing the SCMA was brushed with a glass brush to remove any glue residues and wiped clean with acetone. Test conditions: The outgassing test was performed at Outgassing Services International, in accordance with the ASTM E 1559 measurement method. Chamber pressure: 10-10 torr = 1,33*10-10 mbar. Measurement temperature: 23oC. Test results: • Total outgassed mass after 24 hours was 54.6=g/cm2 • Outgassing rate after 24 hours was 2,0*10-10 g/g/s equivalent to 4,6*10-11 g/cm2 /s. The outgassing rates are illustrated in the graphs below. • Outgassed species was found to be predominantly water (98.7% by mass), but small traces of acetone and possibly fluorocarbons were also found. Analysis: The presence of acetone most likely arises from a cleaning procedure performed after sample assembly and is therefore not considered as severe. The traces of what is believed to be fluorocarbons are presumed to originate from the glue used for the stacking, but the amounts detected are very low. Conclusion: By additional cleaning procedures and by using UHV compatible wires, the tested specimen exhibited only very low outgassing levels, proving the UHV compatibility of stacked actuators.
|